
Measurement time
 We can see how measurements peak at more or less 07:45 in the morning, that's when most HRV4Training users wake up.
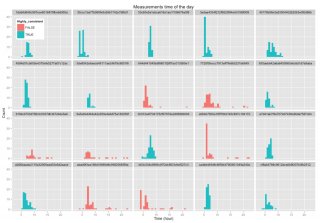
Then, I split all users into two groups, consistent and inconsistent users, based on the standard deviation of the measurement's time of the day. Basically the more variability in the measurement's time, the more likely the user to be labeled inconsistent.
Here is an example of data from 20 users, we can see how the users labeled as inconsistent have measurements more spread out:
Now that we have our two groups (197 consistent users, for about ~10000 measurements, and 180 less consistent users, for another ~8400 measurements), we can perform the usual analysis of acute HRV changes to see if there are any differences between the two groups.
What we do is to compute the daily change in HRV on a day following a training, and then break it down by training intensity, based on manual annotations reported by the users. Here is what we obtain:
The two plots on the left refer to users measuring consistently more or less at the same time every day, while the two plots on the right are relative to less consistent users.
We can highlight a couple of things: first, for both groups we can clearly see a difference between rest day and training day. HRV is typically increased following a day of rest, and is typically decreased following training. However, the differences are more marked when measurements are more consistent (see the two top plots). Secondly, when we try to break down the relation between HRV and training by training intensity, things get more complicated. For consistent users, we see a gradual decrease in HRV with increased intensity, pretty much what we expect. Rest days cause an increase in HRV, easy trainings are a bit all over the place (might stimulate parasympathetic activity), while average and intense trainings clearly show reduced HRV. On the other hand, for inconsistent users (bottom right plot), we see the expected results only for intense trainings. The rest of the data is more difficult to interpret, with average intensity trainings showing no consistent decrease in HRV.
 What does this mean? It could mean that being more consistent with our measurement makes it easier to interpret HRV data in the context of training. This is what we would expect, since as we know physiological stress is affected by a long list of factors, and the more we are consistent (on all aspects of our measurements and lifestyle) the better.
However, it could also be that the consistent measurements are taken by hardcore athletes with a primary focus in training, while less consistent measurements are taken by users with all sort of other things on their mind, therefore making our conclusions less valid. Hard to say.
What we can do though, is to look at the two group's characteristics, to determine if there are marked differences in their composition or not. The more similar the groups, the more we might trust our speculation on the relation between measurements consistency and interpretation of acute HRV changes with respect to training.
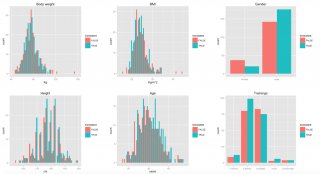
Here are the user's characteristics:
And here are the user's average heart rate and heart rate variability (rMSSD):
And finally a breakdown by sport:
From these plots it seems the two groups are fairly similar. They certainly are in terms of HR/HRV, as well as in terms of trainings per week, height, body weight, BMI and sports practiced. Men seem to be slightly more consistent, same holds for older user.
Since the analysis of acute HRV changes is performed at the individual level (i.e. we analyze how HRV changes with respect to a person's previous day value, regardless of other users), these small differences should not affect much this analysis.
Summary
We've talked multiple times about the importance of following best practices for short, unconstrained HRV measurements. The main point is to try to make these measurements as close as possible to what we typically measure in clinical practice under laboratory conditions.Measurement time of the day is an important parameter, and it certainly reflects how "stable" our lifestyle is. In this analysis we've seen how interpretation of acute HRV changes seems easier (and probably less confounded by other factors) when we are more consistent with our measurements.
I hope in future posts to be able to perform more of these analysis, in which we can analyze the impact of different parameters on the accuracy and effectiveness of HRV measurements, at a scale that is possible only due to consumer applications like HRV4Training,
HRV4Training on Facebook
HRV4Training is on Facebook. Feel free to use the page as a centralized place for feedback, bugs report, feature requests or simply open discussions around HRV, training, performance and more.
RELATED VIDEO


Share this Post
Related posts
Rolex Oyster Perpetual Superlative Chronometer Cosmograph
Ref. 16519, White Gold Cosmograph Daytona Rolex, “Oyster Perpetual, Superlative Chronometer, Officially Certified, Cosmograph…
Read More
Time Keeping devices
If youve ever been to Rome, or seen pictures of this magnificent city, then youll have seen one of the many obelisks that…
Read Morelatest post
-
 Interesting October 4, 2022
 -
 We are supported October 4, 2022
 -
 Useful October 4, 2022
 -
 Sources October 4, 2022
 -
 Our partners September 12, 2022
 -
 Resources September 6, 2022
 -
 How to make a water alarm clock? September 6, 2022
 -
 Mauthe clock History September 6, 2022
 -
 Top 10 Watches Men September 4, 2022